cgil-geom2d
a light 2d geometry utility classes like Point, Line written in ES6 Javascript (~12k for the CommonJS lib).
REPOSITORY is now archived and read-only as of 2024-04-29
please consider using this new repository : simple-2d-geometry a full rewrite using TypeScript.
this code is licensed under the terms of the MIT License.
Documentation generated from source with esdoc
Using it inside the browser
you can download the UMD library file dist/geom2d.min.js to your computer then you just need to include it as usual (adapting the path to your case):
<script src="dist/geom2d.min.js"></script>
you can see an example above
you can get a nice explanation for the various library formats in this medium article
but very basically
- cjs (commonjs2): You will use this format in a build tool, it excludes all modules in node_modules folder from bundled files.
- umd: You will use this format directly in browser, all 3rd-party packages (dependencies) will be bundled within.
Installation with npm
Inside an already created npm project directory (do you have a package.json in it ?)
you can as usual install cgil-geom2d in the shell with :
npm install cgil-geom2d --save
then you can import/require the CommonJS bundle in dist/geom2d.cjs.js
Example
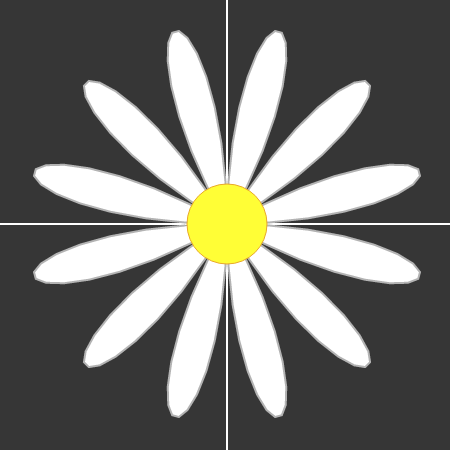
let’s use the library Point class to create a nice 12 petal’s flowers using a polar equation like this : r = a sin 6θ

<script src="../dist/geom2d.min.js"></script>
<svg height="500" width="500">
  <line  id='xaxis' x1="250" y1="0" x2="250" y2="500" class="svgaxis" />
  <line  id='yaxis' x1="0" y1="250" x2="500" y2="250" class="svgaxis" />
  <polyline id='mypolargraph' points="0,40 40,40 40,80 80,80 " class="svg-flower-petal"/>
  <circle cx="250" cy="250" r="40" class="svg-flower-center" />
</svg>
  let ElPolyPolarGraph = document.getElementById('mypolargraph')
  let petalLength = 200
  let coordinatesString = '' // to accumulate the points coordinates
  // let's center the drawing on the svg
  const offsetX = 250
  const offsetY = 250
  // let's iterate over a full 360 degree circle
  for (let angle = 0; angle < 360; angle += 2) {
        let radius = petalLength * Math.sin(6 * geom2d.utils.getRadians(angle)) // need to convert to radians for Math.sin
        let TempPoint = geom2d.Point.fromPolar(radius, angle)
        // move the point so it's centered on the svg
        TempPoint.moveRel(offsetX,offsetY)
        coordinatesString += TempPoint.toString(',', false)  + ' '
  }
  // now update the points attributes in the existing svg polyline to display the flower on screen
  ElPolyPolarGraph.setAttribute('points', coordinatesString)
You can find other polar equations here
Develop
you can clone this repository with a git clone
then run a npm install in the cloned directory
and use the various scripts inside package.json to help you work
create the CommonJS bundle in dist folder
npm run build:CJS
create the UMD bundle in dist folder
npm run build:UMD
run unit tests with jest
npx jest -i --watch
or just
npm run test
run eslint with
npm run lint